Monitor a node
This module will guide you through the steps to set up a monitoring tool that will allow you to track various metrics of an Octez node.
Introduction
Until now, the only tool developers had to monitor the behavior of their Tezos node was to look at the logs, adjust the log verbosity, and reconstruct all relevant information from this stream. But getting more insight into a node's performance was tedious and difficult. For instance, the number of connected peers, the number of pending operations, or the number of times the validator switched branches, were not easy to observe continuously.
After a few iterations of different methods to gather node information and statistics that could be easily analyzed, we have recently chosen to include metrics within the node. With Octez Metrics it's simple to get a myriad of statistics about your node -- and quite efficiently so. You can also attach a Grafana dashboard to get a visual representation of how your node is performing. And with Grafazos, you can get customized ready-to-use dashboards for monitoring your Tezos node.
What metrics can we monitor ?
There are two types of metrics on an Octez node that can be monitored:
- hardware metrics
- node metrics
Here is an exhaustive list of Octez node metrics. Hardware metrics depend on your machine characteristics, but we will focus on performance metrics like the CPU usage, RAM, memory, etc.
Overview of monitoring tools
What is Netdata ?
Netdata is a light and open-source software that collects and exposes hardware metrics of a physical machine, and is capable of collecting fresh data every second. Netdata is a complete tool that provides various graphics visualization (histogram, tables, gauge, points...), alerting + triggering tools, and many other features...
What is Grafana ? 
Basically, Grafana is a software that takes JSON in input and makes dashboards that you can display using your browser (the high-level web interface that displays all the metrics). In our case, JSONs are provided by Grafazos.
What is Grafazos ?
Grafazos is a jsonnet library written by Nomadic Labs, which uses itself grafonet, which is a jsonnet library to write Grafana dashboards as code. Grafazos documentation is here
What is jsonnet ? 
Jsonnet is a programming language that allows to create JSONs easily.
What is Prometheus ? 
Prometheus server is a toolkit that scrapes and stores time series data by making requests to the nodes. Basically, prometheus is fed by both netdata and tezos-metrics (which is deprecated and not used), and then, grafana displays the data gathered by prometheus.
Light monitoring of an Octez node with Netdata
Set up the monitoring
Step 1: Install Netdata on your node host
We recommend to look at "Install on Linux with one-line installer" to make a personalized installation. Else, copy the following command:
wget -O /tmp/netdata-kickstart.sh https://my-netdata.io/kickstart.sh && sh /tmp/netdata-kickstart.sh
Step 2: Add the collector plugin for Octez metrics
Bash plugin:
Create a file named tezosMetrics.chart.sh in /usr/libexec/netdata/charts.d and paste the following bash code into the file.
#!/bin/bash

url=http://127.0.0.1:9091/metrics #Octez metrics' are avaible on port 9091 by default. You can changer the url variable if you haven't the same port.
tezosMetrics_update_every=1
tezosMetrics_priority=1
lastTimestamp=


tezosMetrics_get() {
response=$(curl $url 2>/dev/null)
#With this following command you get all metrics of your node except octez_version{...}
eval "$(echo "$response" | grep -v \# | grep -v octez_version | sed -e 's/[.].*$//g' | sed -e 's/", /_/g'| sed -e 's/{/_/g' | sed -e 's/="/_/g' |  sed -e 's/"}//g'| sed -e 's/ /=/g'| sed -e 's/<//g'| sed -e 's/>//g'| sed -e 's/\//_/g')"
#this command allows to catch "octez_version" metric
eval "$(echo "$response" | grep -v \# | grep octez_version | sed -e 's/, / \n/g' | sed -e 's/{/\n/g'| sed -e 's/}//g' | sed -e 's/ 0.*//g' |tail -n 6 |sed -e 's/^/octez_/')"
return 0
}


#The following function is called once at netdata startup to check the availability of metrics
tezosMetrics_check() {
 status=$(curl -o /dev/null -s -w "%{http_code}\n" $url)
 [ $status -eq 200 ] || return 1
 return 0
}


#The following function is called once at netdata startup to create the charts
tezosMetrics_create() {
response=$(curl $url 2>/dev/null)
metrics=$(echo "$response" | grep -v \# | grep -v octez_version | sed -e 's/", /_/g'| sed -e 's/{/_/g' | sed -e 's/="/_/g' |  sed -e 's/"}//g'| sed -e 's/[ ].*$//g'| sed -e 's/<//g'| sed -e 's/>//g'| sed -e 's/\//_/g')
#CHART type.id name title units family context charttype priority update_every options plugin module
#DIMENSION id name algorithm multiplier divisor options
#More details here: https://learn.netdata.cloud/docs/agent/collectors/plugins.d
for metric in $metrics #this loop creates the charts and the dimensions of all metrics except octez_version metric (because of its format is a bit different)
do
cat << EOF
CHART tezosMetrics.$metric '' "$metric" "" tezosMetricsFamily tezosMetricsContext line $((tezosMetrics_priority)) $tezosMetrics_update_every '' '' 'tezosMetrics'
DIMENSION $metric absolute 1 1
EOF
done
#The code below creates the chart for octez_version
eval "$(echo "$response" | grep -v \# | grep octez_version | sed -e 's/, / \n/g' | sed -e 's/{/\n/g'| sed -e 's/}//g' | sed -e 's/ 0.*//g' |tail -n 6 |sed -e 's/^/octez_/')"
cat << EOF
CHART tezosMetrics.octez_version '' 'node_version: $octez_version | octez_chain_name: $octez_chain_name | octez_distributed_db_version: $octez_distributed_db_version | octez_p2p_version: $octez_p2p_version | octez_commit_hash: $octez_commit_hash | octez_commit_date: $octez_commit_date' '' tezosMetricsFamily tezosMetricsContext line $((tezosMetrics_priority)) $tezosMetrics_update_every '' '' 'tezosMetrics'
DIMENSION 'octez_version' 'node_version: $octez_version | octez_chain_name: $octez_chain_name | octez_distributed_db_version: $octez_distributed_db_version | octez_p2p_version: $octez_p2p_version | octez_commit_hash: $octez_commit_hash | octez_commit_date: $octez_commit_date' absolute 1 1
EOF
return 0
}


#The following function update the values of the charts
tezosMetrics_update() {
tezosMetrics_get || return 1
for metric in $metrics
do
cat << VALUESOF
BEGIN tezosMetrics.$metric $1
SET $metric = $[$metric]
END
VALUESOF
done
#The code below updates the octez_version metric chart
cat << EOF
BEGIN tezosMetrics.octez_version $1
SET octez_version = 0
END
EOF

return 0
}
Step 3: Open the metrics port of your node
When starting your node, add the --metrics-addr=:9091 option to open a port for the Octez metrics. (By default the port is 9091, but you can arbitrarily choose any other one, at your convenience. Just make sure to change the port in the plugin code accordingly.).
Here is an example, when launching your Tezos node:
octez-node run --rpc-addr 127.0.0.1:8732 --log-output tezos.log --metrics-addr=:9091
Step 4: Restart the Netdata server
Once you've gotten the plugin on your machine, restart the Netdata server using:
sudo systemctl restart netdata
Step 5: Open the dashboard
You have in fact two ways to open your dashboard:
You can access Netdata's dashboard by navigating to http://NODE:19999 in your browser (replace NODE by either localhost or the hostname/IP address of a remote node)
You can also use Netdata Cloud to create custom dashboards, monitor several nodes, and invite users to watch your dashboard... It's free of charges and your data are never stored in a remote cloud server, but rather in the local disk of your machines.
We recommend using Netdata Cloud for a more user-friendly usage. The rest of this tutorial is based on Netdata Cloud.
Step 6: Create a custom dashboard with Netdata Cloud!
Netdata provides a really intuitive tool to create custom dashboards. If you wants more details, read Netdata documentation.
Here is an exhaustive list of Octez node metrics. With Netdata, your node metrics will have this format: "tezosMetrics.name_of_your_metric".
For instance, you can monitor the following relevant metrics:
octez_versionto get the chain name, version of your node, the Octez commit date, etc.octez_validator_chain_is_bootsrtappedto see if your node is bootstrapped (it returns 1 if the node is bootstrapped, 0 otherwise).octez_p2p_connections_outgoingwhich represents the number of outgoing connections.octez_validator_chain_last_finished_request_completion_timestampwhich is the timestamp at which the latest request handled by the worker was completed.octez_p2p_peers_acceptedis the number of accepted connections.octez_p2p_connections_activeis the number of active connections.octez_store_invalid_blocksis the number of blocks known to be invalid stored on the disk.octez_validator_chain_head_roundis the round (in the consensus protocol) of the current node’s head.ocaml_gc_allocated_bytesis the total number of bytes allocated since the program was started.octez_mempool_pending_appliedis the number of pending operations in the mempool, waiting to be applied.
You can also monitor relevant hardware data (metrics name may differ depending on your hardware configuration):
disk_space._to get the remaining free space on your disks.cpu.cpu_freqto get the frequency of each core of your machine.system.ramto get the remaining free RAM and its overall usage.
Plenty of other metrics are available, depending on your machine and needs.
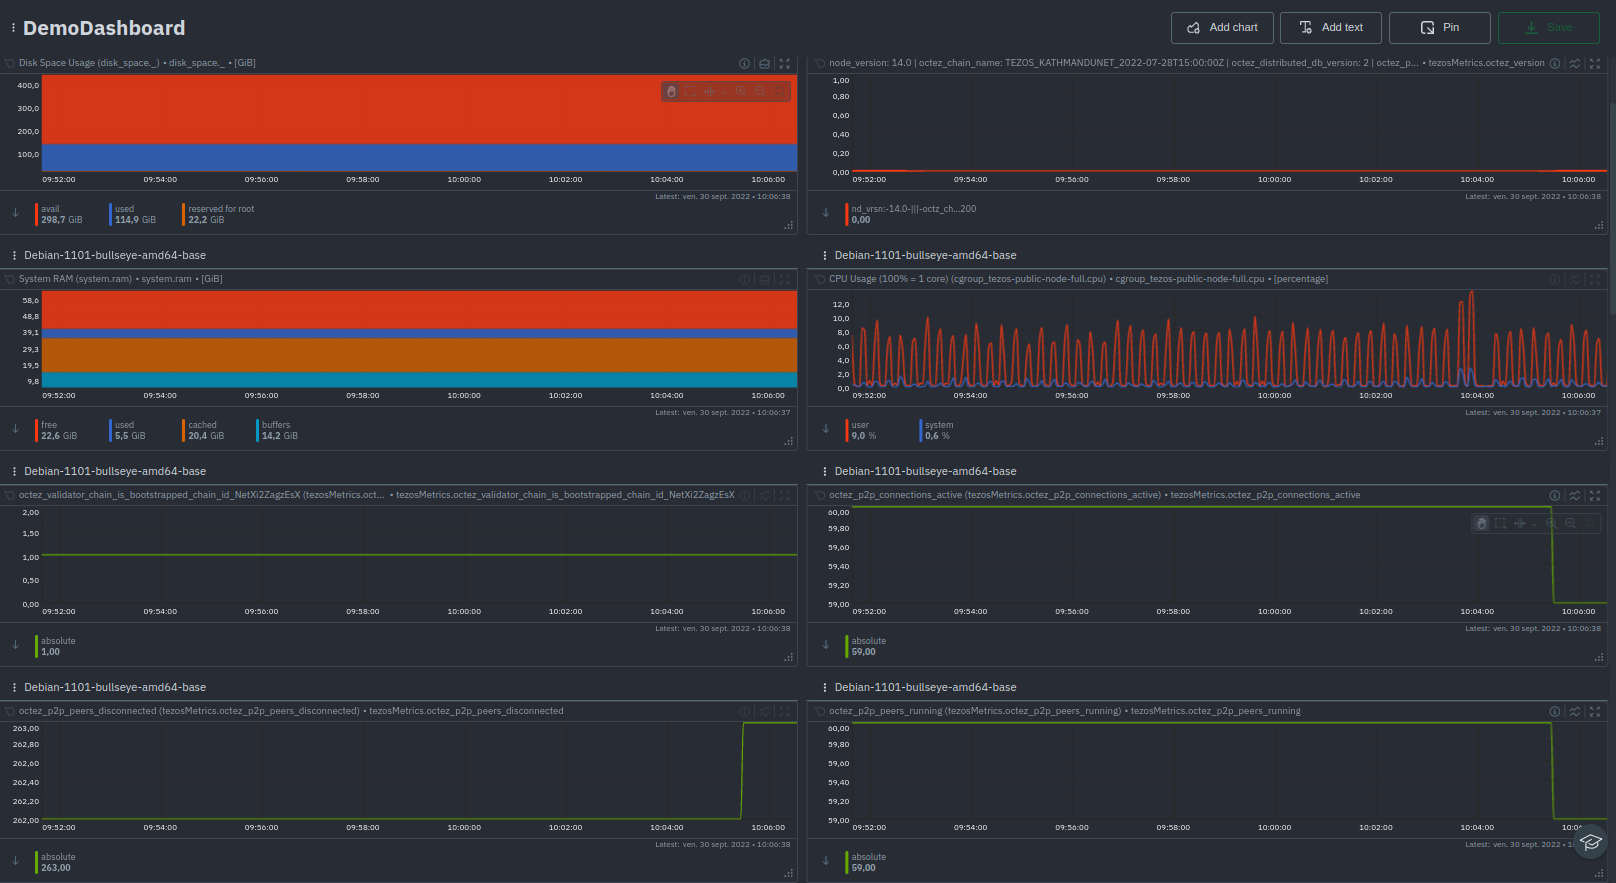
This is an example of a Demo Dashboard with the following metrics:
octez_versionoctez_validator_chain_is_bootstrappedDisk Space UsageCPU UsageRAM Usageoctez_p2p_connections_activeoctez_p2p_peers_runningoctez_store_last_written_block_size
Monitoring several nodes
Step 1. Install Netdata on each of the machines hosting your nodes as described in step 1 of "Set up the monitoring" part.
Step 2. On Netdata Cloud click on the button Connect Nodes, and follow the instructions.
Managing alerts
Netdata sets up alerts by default for some predefined metrics which may not fit your needs. You can set up personalized ones to be received automatically by email, Slack, or SMS.
How to reach config files?
Go to /etc/netdata and use the command edit-config to edit config files.
For example, to edit the cpu.conf health configuration file, run:
cd /etc/netdata
sudo ./edit_config health.d/cpu.conf
To list config files available just use ./edit-config command. Alert file names have this format: health.d/file_name.conf
(Configuration files are stored in /usr/lib/netdata/conf.d and alerts in health.d folder)
Manage existing alerts: Edit health configuration files
You can manage existing alerts by editing health configuration file.
For example, here is the first health entity in health.d/cpu.conf:
template: 10min_cpu_usage #Name of the alarm/template.(required)
      on: system.cpu #The chart this alarm should attach to.(required)
      os: linux #Which operating systems to run this chart. (optional)
   hosts: * #Which hostnames will run this alarm.(optional)
  lookup: average -10m unaligned of user,system,softirq,irq,guest #The database lookup to find and process metrics for the chart specified through on.(required)
   units: %
   every: 1m #The frequency of the alarm.
   #"warn" and "crit" expressions evaluating to true or false, and when true, will trigger the alarm.
    warn: $this > (($status >= $WARNING)  ? (75) : (85))
    crit: $this > (($status == $CRITICAL) ? (85) : (95))
   delay: down 15m multiplier 1.5 max 1h #Optional hysteresis settings to prevent floods of notifications.
    info: average cpu utilization for the last 10 minutes (excluding iowait, nice and steal)
      to: sysadmin
Here is an exhaustive liste of alerts parameters.
Create personalized alerts: Write a new health entity
To create personalised alerts, create a .conf file in /usr/lib/netdata/conf.d/health.d and edit this new file using the template shown previously:
As an example, here is a warning alert if the metric octez_p2p_connections_active is below 3 connections, and a critical alert if there are no connections at all (equal to 0):
alarm: tezos_node_p2p_connections_active (cannot be chart name, dimension name, family name, or chart variable names.)
      on: octez_p2p_connections_active
   hosts: *
  lookup: average -10m unaligned of user,system,softirq,irq,guest
    warn: $this<3
    crit: $this==0
    info:  "tezos_node_p2p_connections_actives" represents the current number of active p2p connections with your node.
      to: sysadmin
(You can access official Netdata documentation here)
Documentation about Alerts managing
Basic documentation for configuring health alarms:
https://learn.netdata.cloud/docs/monitor/configure-alarms
Health configuration reference (detailed documentation):
https://learn.netdata.cloud/docs/agent/health/reference
Supported notification endpoints:
https://learn.netdata.cloud/docs/monitor/enable-notifications#supported-notification-endpoints
Manage data retention
The metrics collected every second by Netdata can be stored in the local memory of your machine for a variable duration of time, depending on the desired history. This allows you to keep track of the activity of your node and to watch its evolution over time.
Get netdata.conf file
You can choose how long data will be stored on your local machine. To do so, you will need the netdata.conf file in the /etc/netdata/ repository. If you haven't this file yet, you can download it using the following command:
wget -O /etc/netdata/netdata.conf http://localhost:19999/netdata.conf
You can view your current configuration at: http://localhost:19999/netdata.conf
Calculate the data base space needed
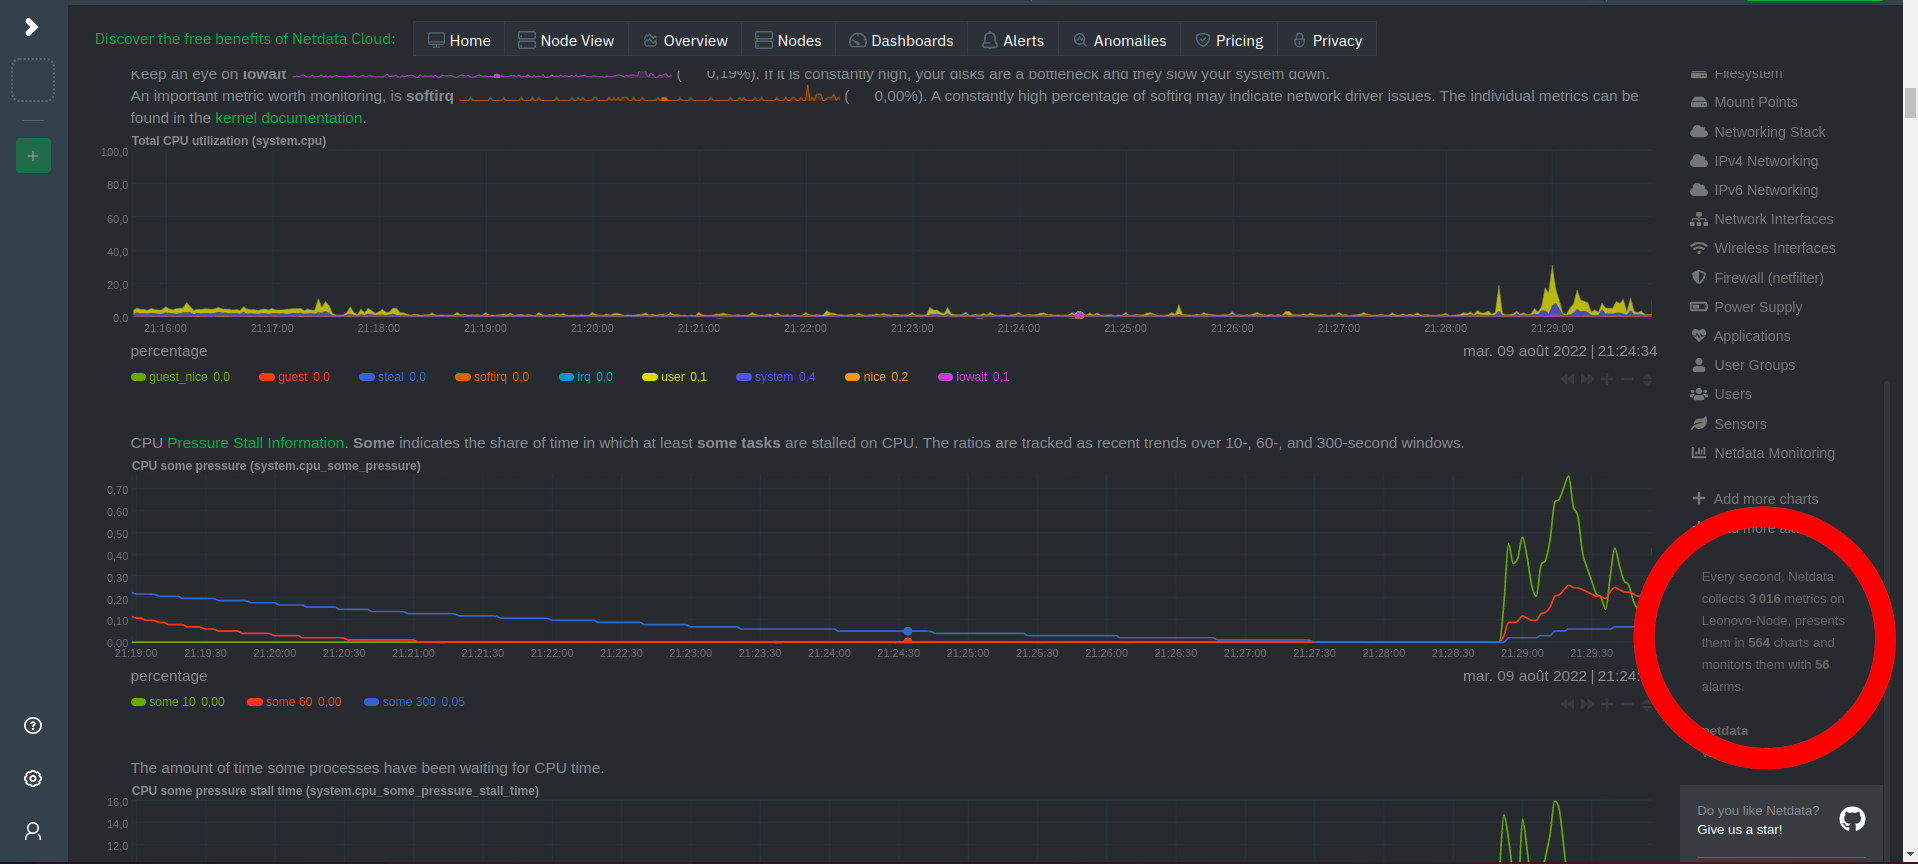
To calculate the space needed to store your metrics you will need:
- The time in seconds of how long you want to keep the data
- The number of metrics (you can find it in your localhost dashboard as shown in the image below)
- The Tier of Netdata (by default 0).
For 2000 metrics, collected every second and retained for a month, Tier 0 needs: 1 byte x 2,000 metric x 3,600 sec per hour x 24 hours per day x 30 days per month = 5,184MB.
Modify netdata.conf file
Now you just have to change the value of "dbengine multihost disk space" in [db] section in netdata.conf file by the value calculated before (in MB).
[db]
 dbengine multihost disk space MB =5184
 dbengine page cache size MB = 32
 # update every = 1
 # mode = dbengine
 # dbengine page cache with malloc = no
 # dbengine disk space MB = 256
 # memory deduplication (ksm) = yes
 # cleanup obsolete charts after secs = 3600
 # gap when lost iterations above = 1
 # storage tiers = 1
 # dbengine page fetch timeout secs = 3
 # dbengine page fetch retries = 3
 # dbengine page descriptors in file mapped memory = no
 # cleanup orphan hosts after secs = 3600
 # delete obsolete charts files = yes
 # delete orphan hosts files = yes
 # enable zero metrics = no
 # dbengine pages per extent = 64
Documentation about data retention
Netdata parameters of metrics retention / Tiering:
https://learn.netdata.cloud/guides/longer-metrics-storage/
Database overview:
https://learn.netdata.cloud/docs/agent/database
The database engine / Tiering:
https://learn.netdata.cloud/docs/agent/database/engine
Change how long Netdata stores metrics:
https://learn.netdata.cloud/docs/store/change-metrics-storage
Daemon configuration:
https://learn.netdata.cloud/docs/agent/daemon/config#global-section-options
Full monitoring of an Octez node with octez metrics
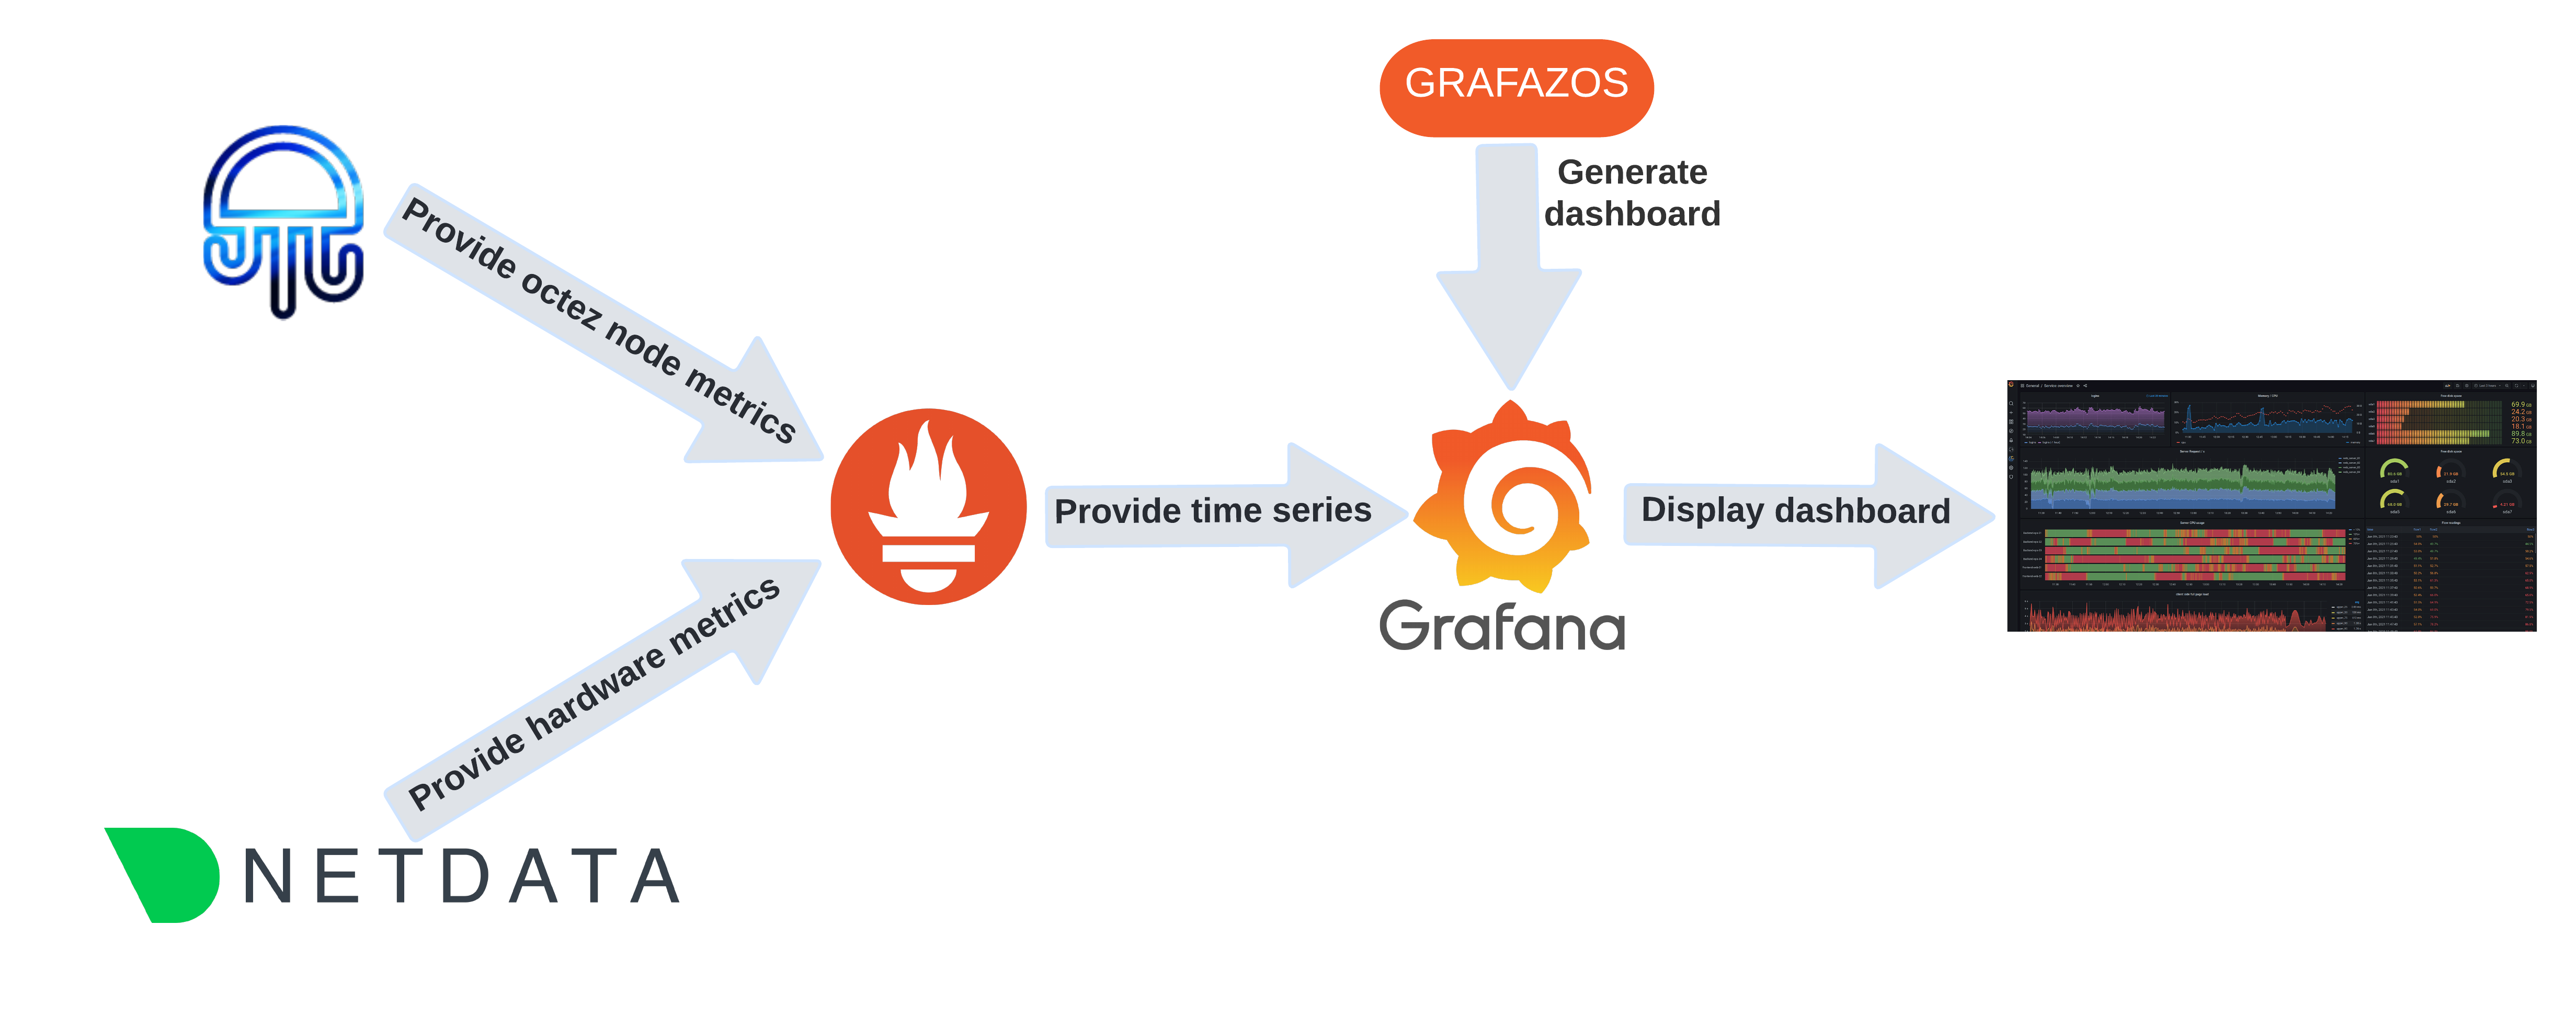
Here is the global picture of a monitoring system, connecting all these tools together:
A Grafazos dashboard looks like this:
As you can immediately see at the top, the dashboard will tell you your node's bootstrap status and whether it's synchronized, followed by tables and graphs of other data points.
Node metrics
In previous versions of Octez, a separate tool was needed for this task. tezos-metrics exported the metrics which were computed from the result of RPC calls to a running node. However, since the node API changed with each version, it required tezos-metrics to update alongside it, resulting in as many versions of tezos-metrics as Octez itself. Starting with Octez v14, metrics were integrated into the node and can be exported directly, making it simple to set up.
Moreover, as the metrics are now generated by the node itself, no additional RPC calls are needed anymore. This is why the monitoring is now considerably more efficient!
Setting up Octez Metrics
To use Octez Metrics, you just start your node with the metrics server enabled. The node integrates a server that registers the implemented metrics and outputs them for each /metrics HTTP request.
When you start your node you add the --metrics-addr option which takes as a parameter <ADDR:PORT> or <ADDR> or :<PORT>. This option can be used either when starting your node, or in the configuration file (see https://octez.tezos.com/docs/user/node-configuration.html).
Your node is now ready to have metrics scraped with requests to the metrics server. For instance, if the node server is configured to expose metrics on port 9932 (the default), then you can scrape the metrics with the request http://localhost:9932/metrics.
The result of the request is the list the node metrics described as:
#HELP metric description
#TYPE metric type
octez_metric_name{label_name=label_value} x.x
Note the metrics are implemented to have the lowest possible impact on the node performance, and most of the metrics are only computed when scraping it. So starting the node with the metrics server shouldn't be a cause for concern. More details on Octez Metrics can be found in the Tezos Developer Documentation: see here for further detail on how to setup your monitoring; and here, for the complete list of the metrics scrapped by the Octez node.
Types of metrics
The available metrics give a full overview of your node, including its characteristics, status, and health. In addition, they can give insight into whether an issue is local to your node, or it is affecting the network at large -- or both.
The metric octez_version delivers the node's main properties through label-value pairs. It provides the node version or the network it is connected to.
Other primary metrics you likely want to see are the chain validator1 ones, which describe the status of your node: octez_validator_chain_is_bootstrapped and octez_validator_chain_synchronisation_status. A healthy node should always have these values set to 1. You can also see information about the head and requests from the chain validator.
There are two other validators, the block validator2 and the peer validator3, which give you insight on how your node is handling the progression of the chain. You can learn more about the validators here
To keep track of pending operations, you can check the octez_mempool metrics.
You can get a view of your node's connections with the p2p layer metrics (prefixed with octez_p2p). These metrics allows you to keep track of the connections, peers and points of your node.
The store can also be monitored with metrics on the save point, checkpoint and caboose level, including the number of invalid blocks stored, the last written block size, and the last store merge time.
Finally, if you use the RPC server of your node, it is likely decisive in the operation of your node.
For each RPC called, two metrics are associated: octez_rpc_calls_sum{endpoint="...";method="..."} and octez_rpc_calls_count{endpoint="...";method="..."} (with appropriate label values). call_sum is the sum of the execution times, and call_count is the number of executions.
Note that the metrics described here are those available with Octez v14--it is likely to evolve with future Octez versions.
Dashboards
While scraping metrics with server requests does give access to node metrics, it is, unfortunately, not enough for useful node monitoring. Since it only gives a single slice into the node's health, you don't really see what's happening over time. Therefore, a more useful way of monitoring your node is to create a time series of metrics.
Indeed, if you liked the poster, why not see the whole movie?
The Prometheus tool is designed for this purpose which collects metric data over time.
In addition, in order to get the most out of your metrics, it should be associated with a visual dashboard. A Grafana dashboard generated by Grafazos gives a greater view into your node. Once your node is launched, you can provide extracted time series of metrics to Grafana dashboards.
The Grafazos version for Octez v14 provides the following four ready-to-use dashboards:
octez-compact: A compact dashboard that gives a brief overview of the various node metrics on a single page.octez-basic: A basic dashboard with all the node metrics.octez-with-logs: Same as basic but also displays the node's logs, with Promtail Promtail (for exporting the logs).octez-full: A full dashboard with the logs and hardware data. This dashboard should be used with Netdata (for supporting hardware data) in addition to Promtail.
Note that the last two dashboards require the use of additional (though standard) tools for hardware metrics and logs (Netdata, Loki, and Promatail).
Let's look at the basic dashboard in more detail. The dashboard is divided into several panels. The first one is the node panel, which can be considered the main part of the dashboard. This panel lays out the core information on the node such as its status, characteristics, and statistics on the node's evolution (head level, validation time, operations, invalid blocks, etc.).
The other panels are specific to different parts of the node:
- the p2p layer;
- the workers;
- the RPC server;
along with a miscellaneous section.
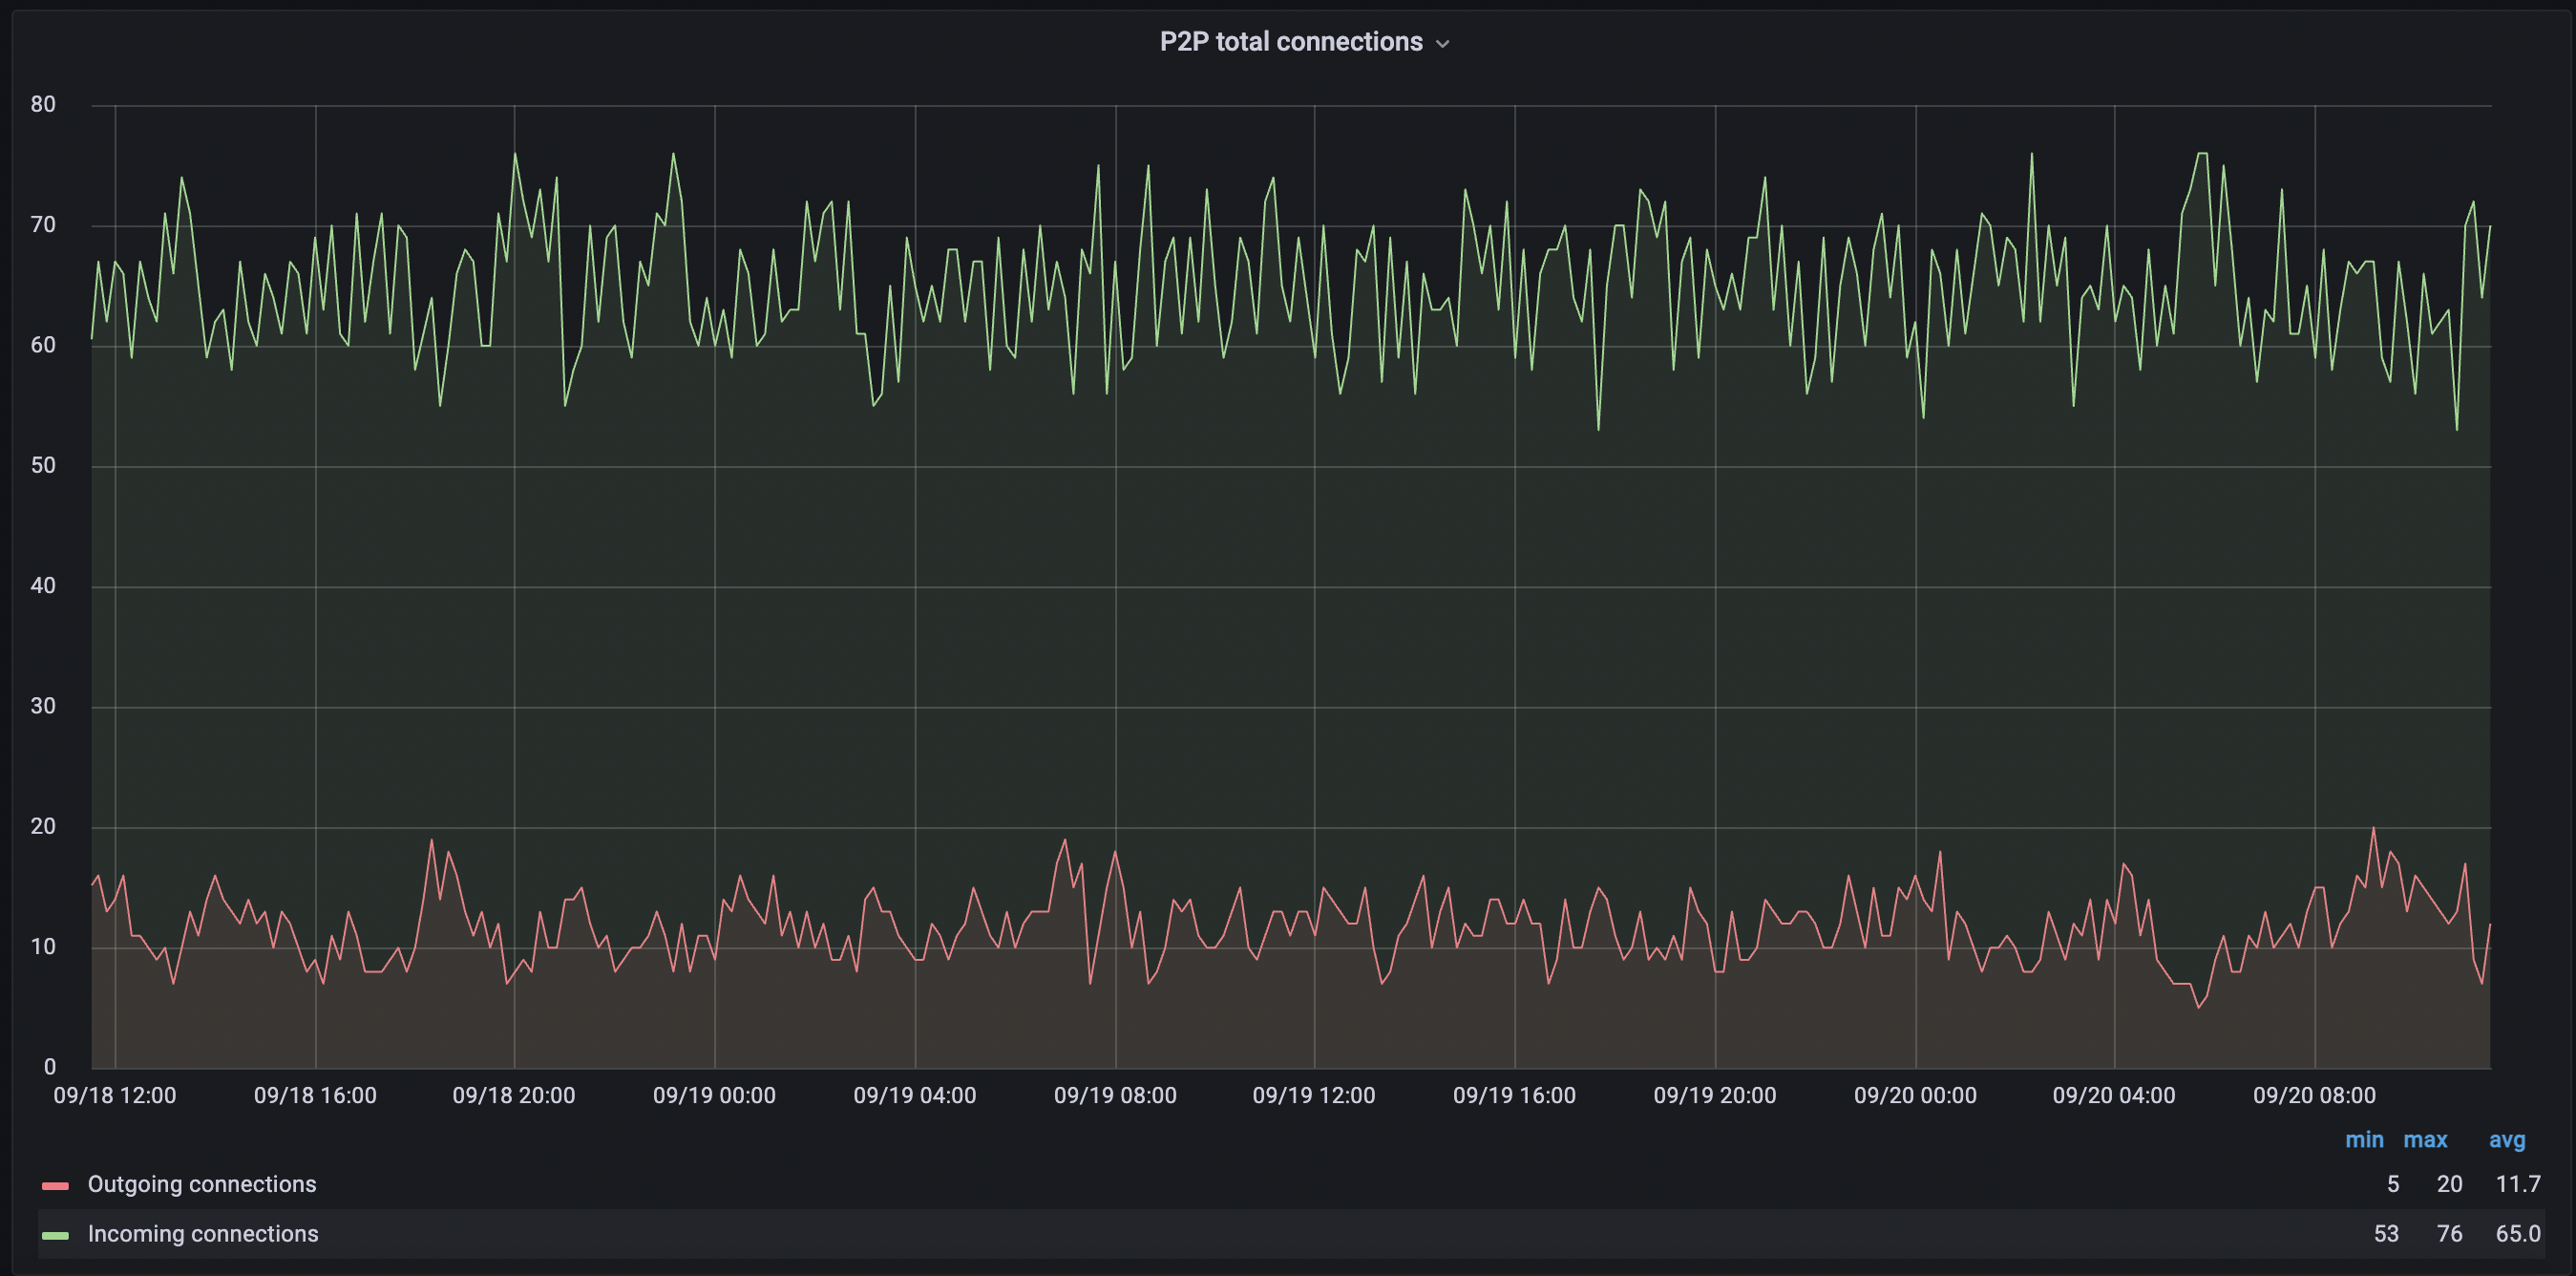
Some metrics are self-explanatory, such as P2P total connections, which shows both the connections your node initiated and the number of connections initiated by peers. Another metric you may want to keep an eye on is Invalid blocks history, which should always be 0 -- any other value would indicate something unusual or malicious is going on.
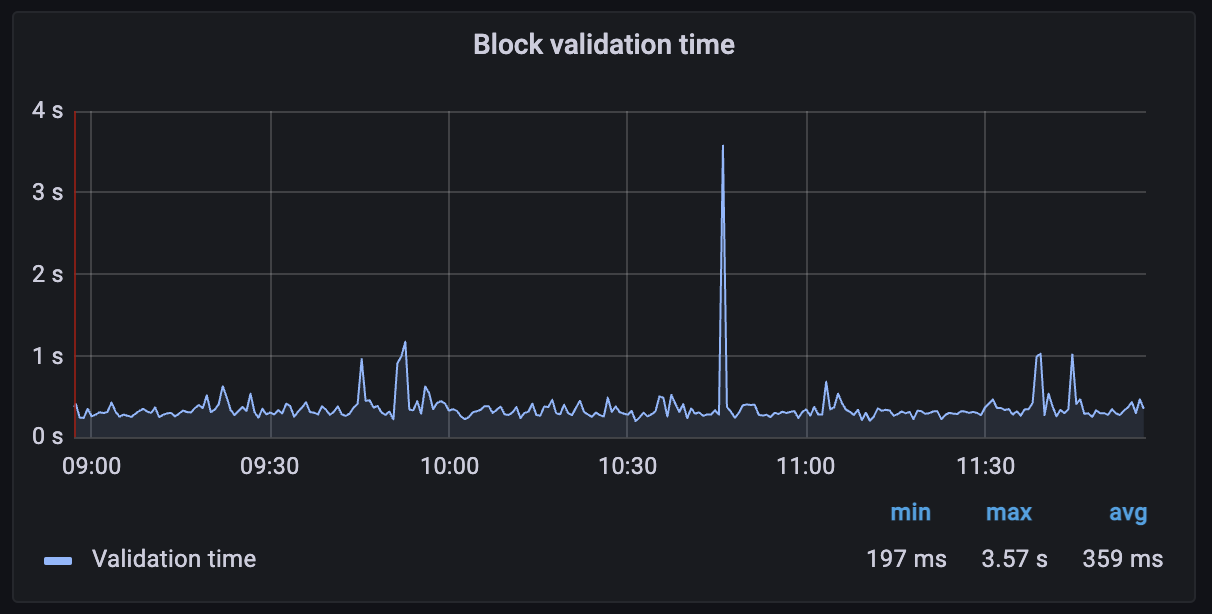
Another useful metric is the Block validation time, which measures the time between when a request is registered in the worker till the worker pops the request and marks it as complete. This should generally be under 1 second. If it's persistently longer, that could indicate trouble too.
The P2P connections graph will show you immediately if your node is having trouble connecting to peers, or if there's a drop-off in the number of connections. A healthy node should typically have a few dozen peer connections (depending on how it was configured).
The Peer validator graph shows a number of different metrics including unavailable protocols. An up-to-date, healthy node should see this as a low number. If not it can indicate that your node is running an old version of Octez, or that your node is being fed bad data from peers.
Note again these dashboards are built for Octez v14 and are likely to evolve with the Octez versions.
Working with Grafazos
Grafazos allows you to set different options when generating the ready-to-use dashboards described above. For instance, you can specify the node instance label, which is useful for a dashboard that aims to monitor several nodes.
Furthermore, you can manually explore the metrics from the Prometheus data source with Grafana and design your own dashboards. Or you can also use Grafazos to import ready-to-use dashboards for your node monitoring. You can find the packages stored here. There is a package for each version of Octez.
Grafana is a relatively user-friendly tool, so play with creating a custom one as you like. You may also want to use the "explore" section of Grafana. Grafazos is also particularly useful in automatic deployment of Tezos nodes via provisioning tools such as Puppet or Ansible.
Conclusion
We developed Octez Metrics to give Tezos users a better insight into how their node is performing, and to observe the overall network health. This is a product that will continuously improve, and we encourage node operators and bakers to suggest new features and additional metrics that they would like to see. We recognize that the best way to keep your node healthy -- and in turn, to keep the entire Tezos network healthy -- is to provide everyone the tools needed to monitor their setup.
- The chain validator is responsible for handling valid blocks and selecting the best head for its chain.↩
- The block validator validates blocks and notifies the corresponding chain validator.↩
- Each peer validator treats new head proposals from its associated peer, retrieving all the operations, and if valid, triggers a validation of the new head.↩